Troubleshooting Splunk Enterprise Performance

Good Data Imbalance 24h


If you manage an on-prem Splunk Enterprise environment, you will often have to check to make sure that everything is performing optimally. The primary limitations to your environments search capacity will be the IOPS of disks in your Indexers (Search Peers) and CPU/Memory of your Search Heads. As long as your meeting the Splunk requirements for IOPS, then the Indexer side should be sufficient. In most cases, if you are still have search issues related to the Indexers, add more Indexers, i.e., scale out rather than up in most cases, but most importantly, meet the IOPS requirements. As for the Search Head, this can benefit from both scaling up, out, and adjusting your Splunk configurations depending on what’s available to you. When Splunk is under-performing, it can become a good idea to review the following:

  1. Review Data (Im)balance
  2. Assess Disk Performance
  3. Identify Slow Indexers
  4. Assess CPU/Memory Performance
  5. Guesstimate Scheduled Search Capacity

1. Review Data (Im)balance

Run the below search over the last 24 hours to check for data imbalance. Below are sample screenshots of both good and bad data imbalance scenarios. The search shows the number of events being indexed by each of your Splunk indexers. To keep things visually clear, this environment comprises 4 non-clustered indexers.

To begin remediating, I would try to identify any problematic indices first, and then taking steps to narrow down if there are just a few forwarders or sources that are responsible. At that point, it should be much easier to identify whether there is a misconfiguration, most likely in the outputs.conf or props.conf file.

| tstats count where index=* by span=1s _time splunk_server
| timechart span=1s useother=false sum(count) by splunk_server
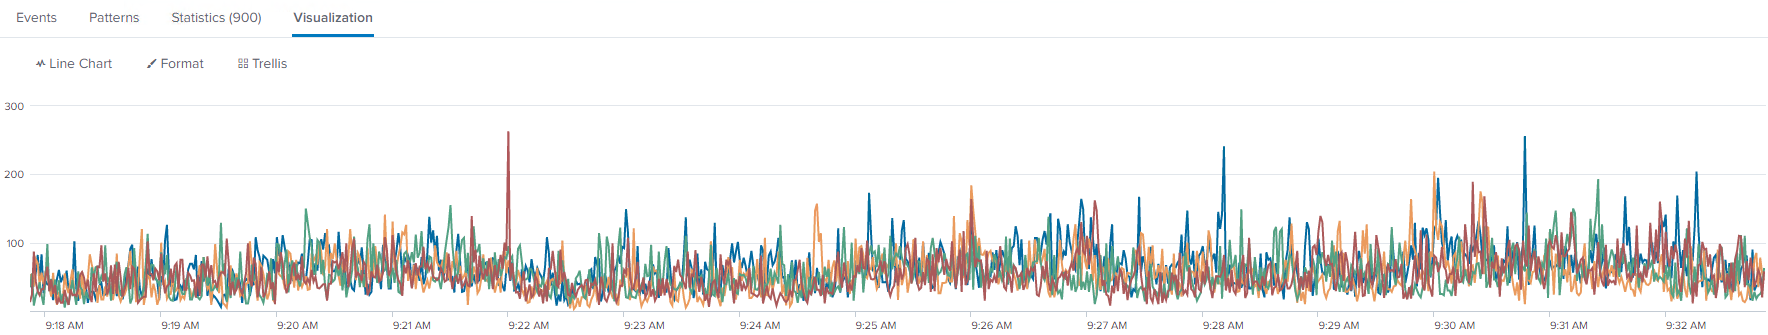
Good Data Imbalance

When data is balanced, you should see events spread relatively evenly and few spikes. This means data is breaking evenly and being evenly distributed to your indexers.
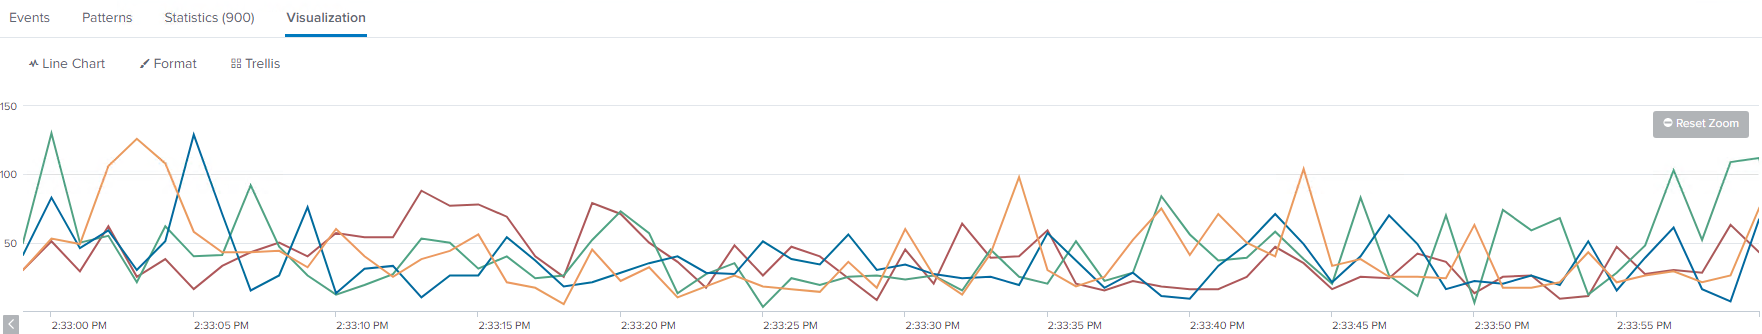
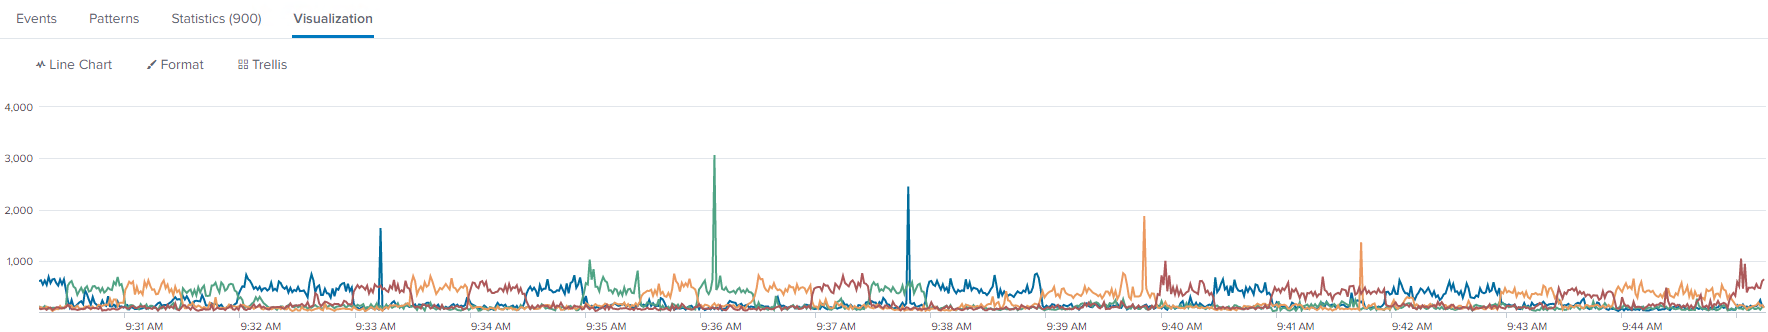
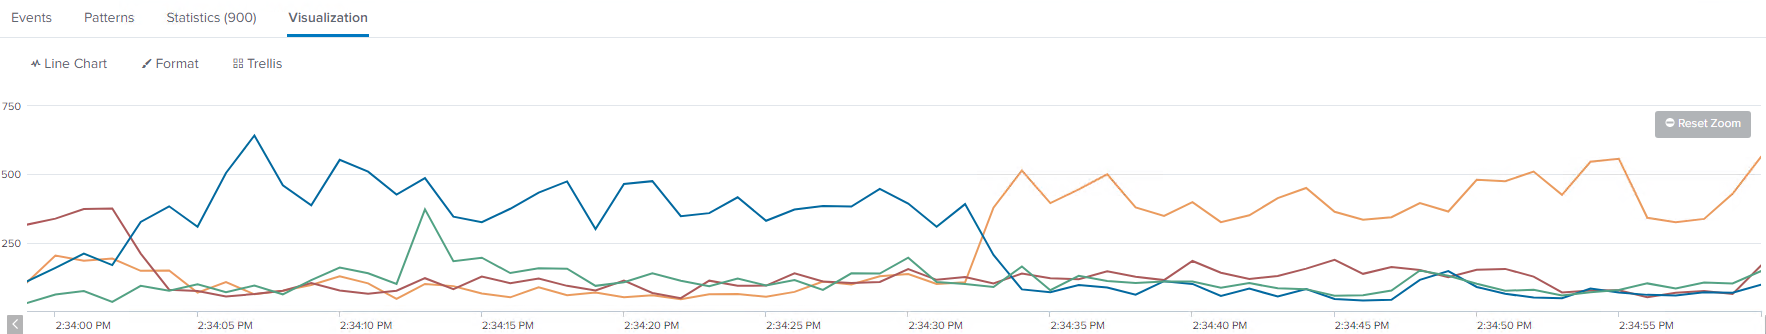
Good Data Imbalance 24h
Good Data Imbalance (24 hours)
Good Data Imbalance 1m
Good Data Imbalance (Zoomed In 1 minute)

Bad Data Imbalance

With bad data imbalance, you can see spikes of events going to a single indexer or two at a time. In the below example, there is a lower line around 150, which shows good looking data distribution. However, there is a line around 500, which clearly shows that one log source is not breaking events properly. In this example, it is a single poorly configured forwarder. This is not the worst scenario, but not ideal. The more spikes and inconsistencies, the worse the data imbalance problem may be in your environment.

Even if there is no single source of the issue, a natural imbalance can occur over time. If so, then you should still customize the outputs.conf settings for your environment. Once your incoming data looks more balanced, then you can rebalance the existing data if you are using an indexer cluster.

Bad Data Imbalance 24h
Bad Data Imbalance (24 hours)
Bad Data Imbalance 1m
Bad Data Imbalance (Zoomed In 1 minute)

2. Assess Disk Performance

Each indexer should be able to search roughly 125,000 events/sec. The more events/second is better. Run the following search in Fast Mode (Last 4 hours is usually sufficient). Since we are using Fast Mode, this is almost a direct test of pure disk performance in searches.

index=_internal 
| stats count by splunk_server

Use the job inspector to see the number of events and how many seconds it took. If your results are below the expected numbers, then you should scroll down and see if one or more indexers are the root cause of the slow performance.
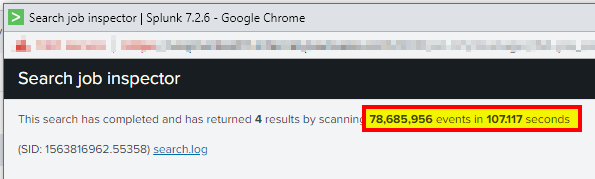
Splunk IOPS Test

    \[\frac{78,685,956 \text{ events}}{107,117 \text{ seconds}} / 4 \text{ indexers} = \textbf{183,644 \text{events per second per indexer}}\]

3. Identify Slow Indexers

If the issue is believed to be related to a specific (search peer), the below stanza can be used to troubleshoot. Add the below lines to the $SPLUNK_HOME/etc/system/local/limits.conf file. This does not require a splunk restart to take effect. Perform a search again, and use the job inspector to see detailed times on how long each action takes on an indexer. Remember to set it to false again after troubleshooting has been completed.

[search_metrics]
debug_metrics = true

4. Assess CPU/Memory Performance

The expected performance for this search is roughly 5,000 events/sec. The more events/second is better. Run the following search in Smart Mode (Last 4 hours is usually sufficient, but use the same time frame as you used for your IOPS test):

index=_internal

Use the job inspector to see the number of events and how many seconds it took. If your results are below the expected numbers, then you should assess whether your search head has enough resources based on the number of users and scheduled searches. Further below are steps to guesstimate your scheduled search capacity.
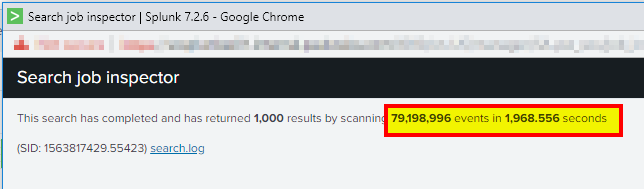
Splunk CPU Memory Test

    \[\frac{78,198,966 \text{ events}}{1,968,556 \text{ seconds}} / 4 \text{ indexers} = \textbf{10,058 \text{events per second per indexer}}\]

5. Guesstimate Scheduled Search Capacity

If your search issue may be related to CPU or Memory, it is most likely an issue on the Search Head. You can start by reviewing the number of users in your environment in addition to the number of scheduled searches configured. Scheduled search settings can be found in the $SPLUNK_HOME/etc/system/local/limits.conf file. See the below default settings and how search capacity can be roughly calculated based on the numbers.

[search]
base_max_searches = 6
max_rt_search_multiplier = 1
max_searches_per_cpu = 1

Assuming the recommended 16 CPU core configuration and the above custom settings, you can see that the number of schedules searches is pretty limited. This is why there are often recommendations for much more CPU and RAM for Enterprise Security deployments.

    \[(16 \text{ CPU cores } \times 1 \text{ max searches per cpu}) + 6 \text{ base max searches} = \textbf{22 \text{total searches}}\]


    \[\lfloor 22 \text{ total searches} \times \frac{1}{2} \rfloor = \textbf{11 \text{scheduled searches}}\]


    \[11 \text{ scheduled searches} \times 1 \text{ max rt search multiplier} = \textbf{11 \text{real time scheduled searches}}\]


    \[\lfloor 11 \text{ scheduled searches} \times \frac{1}{2} \rfloor = \textbf{5 \text{data model accelerations or summaries}}\]

Windows 2016 Shares Not Working via Hostname

Windows Server 2016 Version 1607

Some versions of Windows 2016 have an authentication issue which causes shares to not work via hostname. Shares continue to work via IP, but a registry change must be made for the share to work via hostname. You should first verify that you are definitely not experiencing a DNS issue or a cached credential issue; most of the time, it is a DNS issue.

At least one other post reports similar issues in Windows 10. When this issue arises, a dialog box prompting for credentials will pop-up, but any network credentials will return “Access is denied” and ask you to enter credentials again. The only credentials that will work are local accounts on the server.

Conditions for the Issue

  • Windows Server 2016 Version 1607
  • Enable-SMB1Protocol:  False
  • SmbServerNameHardeningLevel:  1 or 2

You can check the second two items by running the below command from PowerShell.

Get-SmbServerConfiguration

Get-SmbServerConfiguration

The Solution for Shares not Working via Hostname

We fixed this issue with one registry change. Edit the RequiredPrivileges entry in the below path and append SeTcbPrivelege to the end of the list. Additional details about the SeTcbPrivilege parameter are available from Microsoft. Microsoft has claimed that this solution is only a “workaround”, and there should be a hotfix for it in the future.

HKEY_LOCAL_MACHINE\SYSTEM\CurrentControlSet\Services\LanmanServer
LanmanServer RequiredPrivileges

The Cause

The shares do not work via hostname because of a Kerberos authentication issue. IP shares still work because it uses NTLM authentication, whereas FQDN hostname shares use Kerberos. The latest hotfixes have fixed this in most versions of Windows 10 and 2016. However, in Version 1607, it has not been addressed yet by the 2017-08 Update (KB4035631) or Security Update (KB4034658).

We discovered this by poring over many traces and logs while trying to access the shares. A packet analysis shows “STATUS_ACCESS_DENIED” replies to the Session Setup Requests from the Client. An SRV trace reveals an “SPN (cifs/SERVER.DOMAIN.com) is invalid” error.

DNS Debug Log Error with Splunk

DNS Debug Logging

System administrators should turn on advanced debug logging from the DNS Manager console to get the most out of Windows DNS Events. Unfortunately, Microsoft did not design the debug log file for 3rd party logging and monitoring software. Administrators may encounter a DNS debug log error because of this.

A handful of Splunk and McAfee SIEM users have complained that Windows DNS logging stops after a while. Some suggest using a Scheduled Task which works because the log file is recreated every time Restart-Service DNS  is run. This will resolve the DNS debug log error until the file reaches its maximum size again, but it will also restart the DNS Server service quite frequently.

Signs of the DNS Debug Log Error

  • Splunk (or other monitoring software) stops logging DNS events
  • An Event ID 3152 Error shows up around the same time logging stops
  • The debug log file no longer exists in the set file path
  • The file path for the log file is not on the same volume as the Windows OS (C:)

The Solution

Set the DNS debug log file path to a location on the same volume as the Windows OS (C); it’s that simple.

DNS Debug Logging

The Cause

The system backs up and deletes the log file when it reaches its maximum size, then an empty log file of the same filename is created in the same location. However, the log file is recreated in a slightly different way if it is not on the same volume as the OS. This difference is what causes the DNS debug log error that Splunk users may experience. Credit goes to adm at NXLog for finding the solution.

Connect using Windows RSAT with a Non-Domain Joined Machine

When deploying your first Windows Server Core installation, you may find yourself having difficulty managing the server using Windows RSAT. This may be because there is no DOMAIN and one or both the server and workstation are part of a WORKGROUP. Below is the method I use to ensure initial access from a workstation using Windows RSAT Tools.

The demo connects a Windows 10 Pro workstation to manage a Microsoft Hyper-V Server 2012 R2 installation. Remember that you’ll at least need to be running Windows 8.1 to properly remotely manage a Windows 2012 server.

Prerequisites

winrm quickconfig
  • Firewall rules have been configured. If you are just testing, you can easily turn of the firewall by running the following:
netsh advfirewall set allprofiles state off

Instructions

You’ll need to start by opening the Component Services MMC, or Run… dcomcnfg. Expand Component Services, then Computers.

  1. Right-click My Computer and select Properties
  2. Select the COM Security tab
  3. Under the Access Permissions section, click Edit Limits…
  4. Highlight ANONYMOUS LOGIN
  5. Check the box next to Remote Access; by default it should be unchecked
RSAT dcomcnfg settings

Next, you’ll want to run PowerShell as an Administrator. The name of my lab server is “2012CORE” and the user is “2012CORE\Administrator“. You’ll want to replace these with your own values.

The first line will add credentials for your server to Windows Credential Manager. The second line adds your server’s DNS hostname to the TrustedHosts list. You cannot use an IP for this. If your workstation cannot reach the server via hostname, you may need to update the hosts file manually. Finally, the third line is used to verify that your server now appears in the TrustedHosts list.

cmdkey /add:2012CORE /user:2012CORE\Administrator /pass
Set-Item "WSMan:\localhost\Client\TrustedHosts" 2012CORE
Get-Item -Path WSMan:\localhost\Client\TrustedHosts | fl Name, Value
RSAT PowerShell

Hopefully, this will help you remotely manage that core server outside of your domain using Windows RSAT.

Fix Windows 10 Apps Not Working

Windows 10 Apps not working

A handful of users have encountered an issue with some or all of their Windows 10 Apps not working after an update. For myself, I noticed this happen when I tried to open my Calculator and Store apps. According to the Programount blog, this often happens if you have your display scale above 100% or multiple languages installed. In my case, I have multiple languages.

If you’re lucky, the Windows apps troubleshooter will fix the problem. If not, there are a number of suggested solutions by Microsoft, but for many like myself, nothing seems to work. Some suggestions like performing a clean install or creating a new user profile and transferring all your data circumvent the issue with Windows 10 Apps not working, but they don’t actually “fix” the problem. However, some have also stated that creating a new user only temporarily resolves the issue.

To fix my Windows 10 Apps not working, I had to try (and fail) reinstalling them using the PowerShell commands, then go digging in the Event Viewer for the specific cause of the issue.  Below are the steps I followed to repair my Store App.

  1. Open a PowerShell window; be sure to Run as Administrator…
  2. Search for the App by Name using the following command:
Get-AppxPackage -Name <em>store</em>
  1. Note the PackageFullName. In this example it is Microsoft.WindowsStore_11602.1.26.0_x64__8wekyb3d8bbwe.
Get-AppxPackage
  1. Try to reinstall the package, and you’ll most likely receive an error:
Add-AppxPackage -register "C:\Program Files\WindowsApps\Microsoft.WindowsStore_11602.1.26.0_x64_ _8wekyb3d8bbwe\AppxManifest.xml" -DisableDevelopmentMode
Add-AppxPackage
  1. Now we’ll have to open up Event Viewer and navigate to the below log and look for the most recent Warning message, and click on the Details tab to identify what is causing the issue. For me the issue was that a file under the ManifestPath was not found, because it did not exist–the file C:\ProgramData\Microsoft\Windows\AppRepository\Microsoft.WindowsStore_11602.1.26.0_neutral_split.language-zh-hans_8wekyb3d8bbwe.xml.
Application and Services Logs
└── Microsoft
    └── Windows
        └── AppXDeployment-Server
            └── Microsoft-Windows-AppXDeplomentServer/Operational
Event Viewer MainfestPath
  1. Navigate to the folder causing the issue. If you do not have permissions to AppRepository, you will have to temporarily make yourself an Owner.
AppRepository Owner
  1. Once you are, you will probably see that the file in the ManifestPath earlier does not exist. Find a similar file and copy and paste it into the folder. I used the Microsoft.WindowsStore_11602.1.26.0_neutral_split.scale-100_8wekyb3d8bbwe.xml file.
  2. Rename it to match the missing file from earlier.
Missing ManifestPath File
  1. Edit the ResourceId in the XML file to match the missing item. For me, it was split.language-zh-hans.
step11
  1. Revert the AppRepository folder’s Owner to NT SERVICE\TrustedInstaller.
  2. Run the PowerShell command again, and it should run without an error
Add-AppxPackage -register "C:\Program Files\WindowsApps\Microsoft.WindowsStore_11602.1.26.0_x64_ _8wekyb3d8bbwe\AppxManifest.xml" -DisableDevelopmentMode
Add-AppxPacakge success
  1. Try opening the App again, and it should work now

Because the Windows 10 Apps may not be working for a number of reasons, this may not solve all the Windows 10 Apps not working issues people are facing, but hopefully it can help some individuals. Regardless, let me know if you have any improvements or insights.

WSUS Configuration Fails: “ALTER DATABASE statement failed”

When you are installing or reinstalling Windows Server Update Services on a Windows Server 2012 machine, the WSUS post-deployment configuration tasks will sometimes fail.

Check the logs in C:\User\<username>\AppData\Temp\, and if the last line before the WSUS configuration failure states: “System.Data.SqlClient.SqlException (0x80131904): Changes to the state or options of database ‘SUSDB’ cannot be made at this time. The database is in single-user mode, and a user is currently connected to it. ALTER DATABASE statement failed” then you should prepare to remove the WSUS role, its associated features, and the database. Of course, you should backup your previous database, especially if this is a machine in production.

This is a snippet of the error that I kept getting in my logs:

2015-05-26 21:17:16  Configuring WID database...
2015-05-26 21:17:16  Configuring the database...
2015-05-26 21:17:19  Establishing DB connection...
2015-05-26 21:17:20  Checking to see if database exists...
2015-05-26 21:17:29  Database exists
2015-05-26 21:17:29  Switching database to single user mode...
2015-05-26 21:17:40  System.Data.SqlClient.SqlException (0x80131904): Changes to the state or options of database 'SUSDB' cannot be made at this time. The database is in single-user mode, and a user is currently connected to it.
ALTER DATABASE statement failed.
   at Microsoft.UpdateServices.DatabaseAccess.DBConnection.DrainObsoleteConnections(SqlException e)
   at Microsoft.UpdateServices.DatabaseAccess.DBConnection.ExecuteCommandNoResult()
   at Microsoft.UpdateServices.Administration.ConfigureDB.ConnectToDB()
   at Microsoft.UpdateServices.Administration.ConfigureDB.Configure()
   at Microsoft.UpdateServices.Administration.PostInstall.Run()
   at Microsoft.UpdateServices.Administration.PostInstall.Execute(String[] arguments)
ClientConnectionId:7c63a033-0472-4602-95ae-e1c80298bf92
Fatal Error: Changes to the state or options of database 'SUSDB' cannot be made at this time. The database is in single-user mode, and a user is currently connected to it.
ALTER DATABASE statement failed.

1. Remove Windows Server Update Services

You will need to remove Windows Server Update Services, WID Database, and WSUS Services from the Server Roles. You will also need to remove the Windows Internal Database from the Features.
WSUS Roles
WSUS Features

2. Delete the C:\Windows\WID folder

Unfortunately, removing the Windows Internal Database feature does not remove the actual database. You should back up this database if necessary, then delete the C:\Windows\WID folder
WSUS Folder

3. Re-install WSUS Role using a Local Admin account

Some have had success reinstalling it as a Domain Admin, however I have had mixed results. But I have never had an issue installing WSUS using a Local Admin account, so I recommend it to anyone who is still having issues installing WSUS and getting through the post-deployment configuration.

Let me know if this works for you or if you run into any other issues with your WSUS deployment.

Enable Remote Disk Management on Windows Server 2012 R2 Core

Remote Disk Management

Microsoft recommends using Windows Server Core for many critical server roles, but that means you need to be a black belt with PowerShell. Even simple things, such as managing disks can be difficult. When you first connect, it is common to get errors such as “Disk Management could not start Virtual Disk Service (VDS) on…” or “The RPC server is unavailable.

This will help you configure Windows Firewall to enable remote disk management on Windows Server 2012 core installations.

Enable Firewall Exceptions on the Client and Server

You will need to enable the exceptions on both the machine you are trying to access (the Server) and the machine you are accessing from (the Client). You can do so with the following command in an elevated Command Prompt or PowerShell:

netsh advfirewall firewall set rule group="Remote Volume Management" new enable=yes

netsh advfirewall firewall set rule group="Remote Volume Management" new enable=yes
Note: My client machine updated 6 rules, but my server only updated 3 rules (as seen in the next screenshot.

On the Server, you can check if all the appropriate exceptions are enabled with the following PowerShell command:

Get-NetFirewallRule | Where { $_.DisplayGroup -Eq "Remote Volume Management" } | Format-Table

Make sure that all three items are enabled (True). If they are not, try running the netsh command again. Also, make sure that the VDS service is running on the Server. It is also a good idea to set the VDS service to start automatically.

Enable-NetFirewallRule -DisplayGroup "Remote Volume Management"

You can also try the commands recommended by Microsoft. They do the same thing as the netsh command above. If you want to see the individual exceptions that are updated, you can run it with the -verbose flag as I did in the screenshot.

Enable-NetFirewallRule -DisplayGroup "Remote Volume Management"

I hope these commands help you manage your Server Core installation.

Reset the Windows Administrator Password

Windows 7 logon screen in a museum exhibition

Every IT technician has run into a situation where they no longer have Local Admin access to a workstation. When it happens, you’ll rarely have a Windows CD nearby to reset the password. That’s where the Offline Windows Password and Registry Editor comes to save the day.

A good technician should never show up on-site without this package in their toolbox. Just download the package, copy it to a USB, and boot from the USB. A copy of the tool is hosted on our site. The original instructions are below:

  1. Get the machine to boot from the CD or USB drive.
  2. Load drivers (usually automatic, but possible to run manual select)
  3. Disk select, tell which disk contains the Windows system. Optionally you will have to load drivers.
  4. PATH select, where on the disk is the system? (now usually automatic)
  5. File select, which parts of registry to load, based on what you want to do.
  6. Password reset or other registry edit.
  7. Write back to disk (you will be asked)

Users should first review the documentation and FAQ before using this tool, but this is the easiest tool we’ve found in our experience. It is also available on CD, for anyone who may not have the option of booting from a USB.